| c o g n e a t o |
Jump to: [ Overview ] [ Format ] [ Spreadsheets & notebooks ]
DocumentationCogneato is a tool for experimental optimization.Experimental optimization includes A/B/n testing and black-box optimization. It helps you find the optimal configuration, parameter settings, or design to optimize the metric you care about, whether it's clicks, revenue, latency, or anything else. Experimental optimization is regularly applied to
OverviewCogneato offers a simple interface to powerful algorithms for optimizing real-world, complex systems. You paste your measurements into the web interface, and Cogneato returns an analysis of them along with a design, i.e., a recommendation of what to measure next. The analysis helps you understand how well you're doing and when you're done. The design ensures you take as few measurements as necessary to find the best settings for your system or product. Format of measurements: Parameters and metricsThe header row of your measurements table gives Cogneato hints about the nature of the problem you're solving. For example: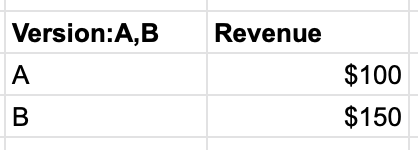 The header row (bolded row) has two columns, which tell Cogneato:
What's required are the colon (":") and the comma. They help Cogneato understand your header.
To get a feel for the format, see the tutorials on the home page. UncertaintySince you're running an experiment, you'll probably take measurements that have some uncertainty. Uncertainty is characterized by standard error. Telling Cogneato about the standard error, which we'll abbreviate as se, helps Cogneato work more efficienly. Let's say version A refers to a website landing page. You showed it to 107 users, and you recorded the revenue generated on each showing. You would compute the mean and standard error of those 107 revenue numbers and record them in a table like this: 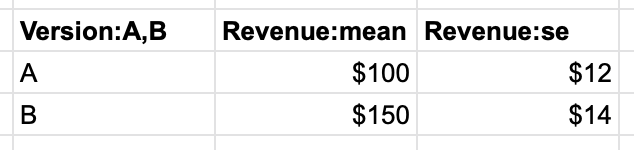 Parameter types: categorical, ordinal, continuousTheversion parameter is a categorical parameter. Categorical parameters take values that are names (strings). You could imagine having more than two versions, say A, B, and C. You would describe them
with this header column:
version:A,B,Cpalette:reds,greens,bluespalette:reds,greens,blues style:friendly,urgent,mysteriousCogneato supports three types of parameters:
Spreadsheets & notebooksYou record your measurements in either a spreadsheet or a Jupyter notebook. These tools are convenient for the task of experimental optimization because:
|
| Copyright © 2024 Vanderdonk, LLC |